

A Beginner Guide for Identifying and Handling Outliers
For Aspiring Data Scientists Have you ever noticed, while going through the rain, that one person walks casually without an […]
A Beginner Guide for Identifying and Handling Outliers Read Post »
For Aspiring Data Scientists Have you ever noticed, while going through the rain, that one person walks casually without an […]
A Beginner Guide for Identifying and Handling Outliers Read Post »
Let’s dive into some sports. It’s American football this time. This article will explore the power of univariate analysis in

The regular expression is commonly known as ‘regex’, ‘re’, or ‘regexp’. It is a powerful tool used to match/find a
Regular Expression — Leap from Rookie to Expert Read Post »
List and Tuple are the classes of Python Data structure; they can store one or more objects or values in
List Vs. Tuple — Essential comparison to avoid Python neophyte’s mistakes. Read Post »
Math is a built-in module that can be used for mathematical tasks like calculations, such as numeric, trigonometric, logarithmic, exponential
10 Python Math Functions confirm that You’re Not a Rookie… Read Post »

This is the continuation of Part 1 of the article “Choose the super speed iteration to process large datasets.” The following 6
Choose the super speed iteration to process large datasets-Part 2 Read Post »
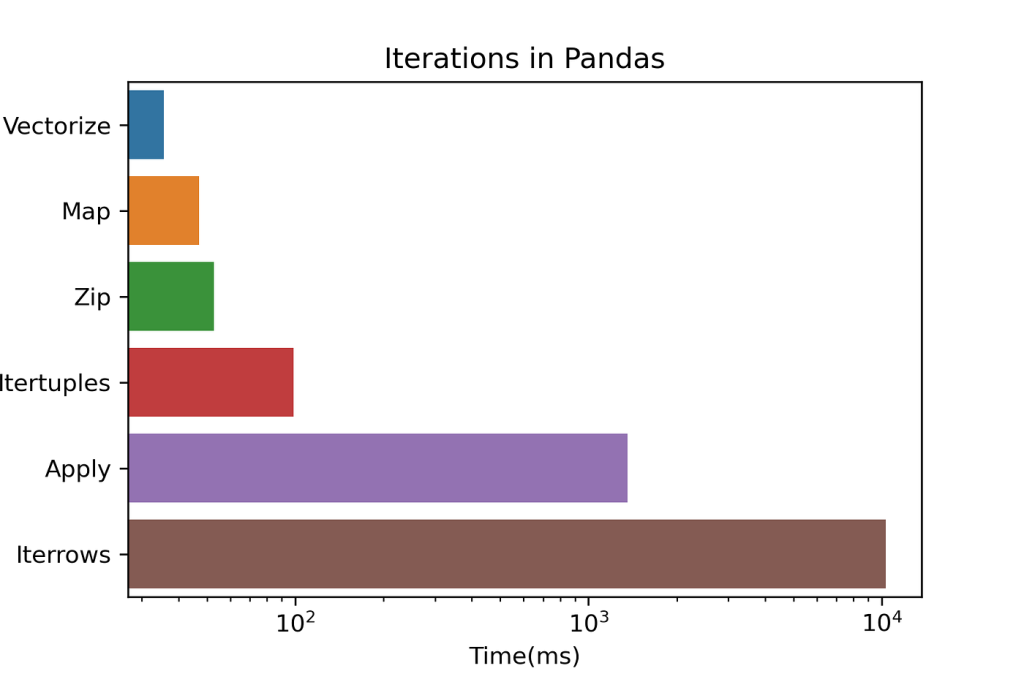
Data Science is a fantasy job until you enter big data analytics 😅😅😅. I went through many challenges while working
Choose the super speed iteration to process large data sets. Read Post »

Data visualization is a method to visualize statistical data to communicate the insights and patterns behind the data. However, plotting
These 3 books may change your way of visualizing the data! Read Post »

Plotting categorical variables is always a challenging task for data scientists. However, there are dozens of libraries that do the
These 7 categorical plots forced me to love Seaborn Library. Read Post »

Pandas is one of the most valuable libraries for data analysis tasks. In analyzing the data deeply, we often slice
3 Effective Methods to Slice Your DataSet using Pandas Read Post »
A Matplotlib Guide for Creating Scatter Plot The primary purpose of a scatter plot is to determine the relationship between
Become a Pro in Scatter Plot Visualization Read Post »
Optimizing the dataset memory is the first and critical step in any data science project. A dataset may contain thousand
How did I convert the 33 GB Dataset into a 3 GB file Using Pandas? Read Post »