
SQL (Structured Query Language) is a powerful tool to manage and querying a relational database. Groupby and aggregate functions play a crucial part in extracting meaningful insights from large datasets for descriptive statistical analysis.
Groupby and aggregate functions enable you to retrieve, analyze, and summarize data from your database table.
Let’s delve into a real-world example to illustrate how these concepts can be applied.
The dataset can be downloaded from:
Indian Premier League (IPL) 2023 Dataset
ball by ball updates of every game
Groupby:
Groupby is frequently used and is one of the essential clauses in SQL. It segments the data into distinct groups based on a specified column/columns.
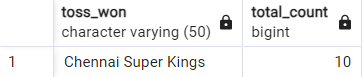
To illustrate, consider a scenario where we examine how many times the Chennai Super Kings won the toss.
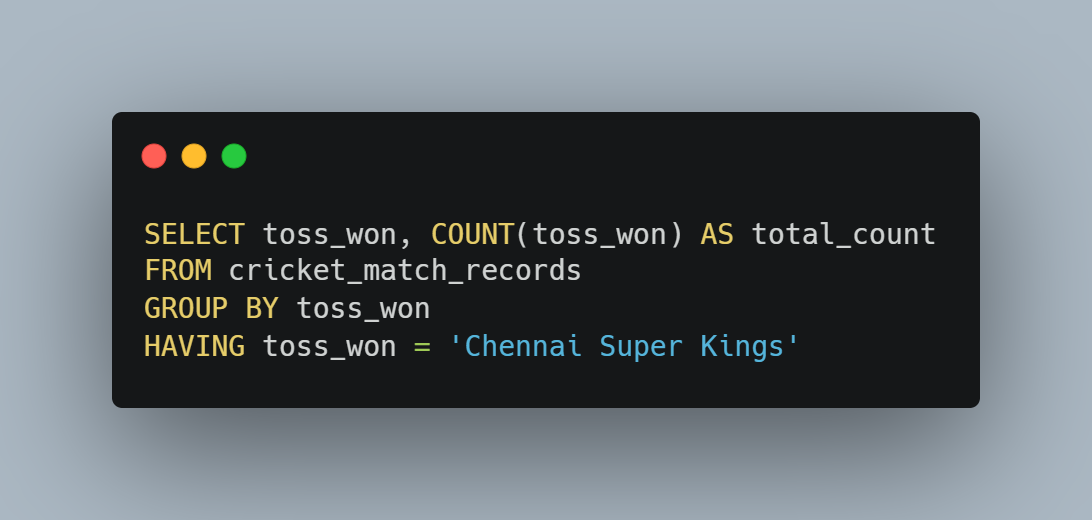
The code groups all team names in each row, and the output reveals the frequency of Chennai Super Kings’ mentions.
It is most efficient when you want to perform operations on each group such as counting, summing, or finding the average values within each group.
Aggregate Functions:
Aggregate functions are part of the SELECT statement and this allows us to filter rows or columns and filter only rows. It is combined with the GROUP BY clause to perform calculations on the grouped data.
They allow you to summarize and obtain statistical information from your data. Common aggregate functions include:
a. COUNT: Calculates the number of rows in each group.
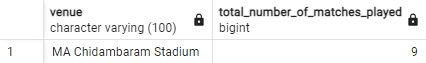
For instance, we use the COUNT function to determine the number of matches played at the MA Chidambaram Stadium.
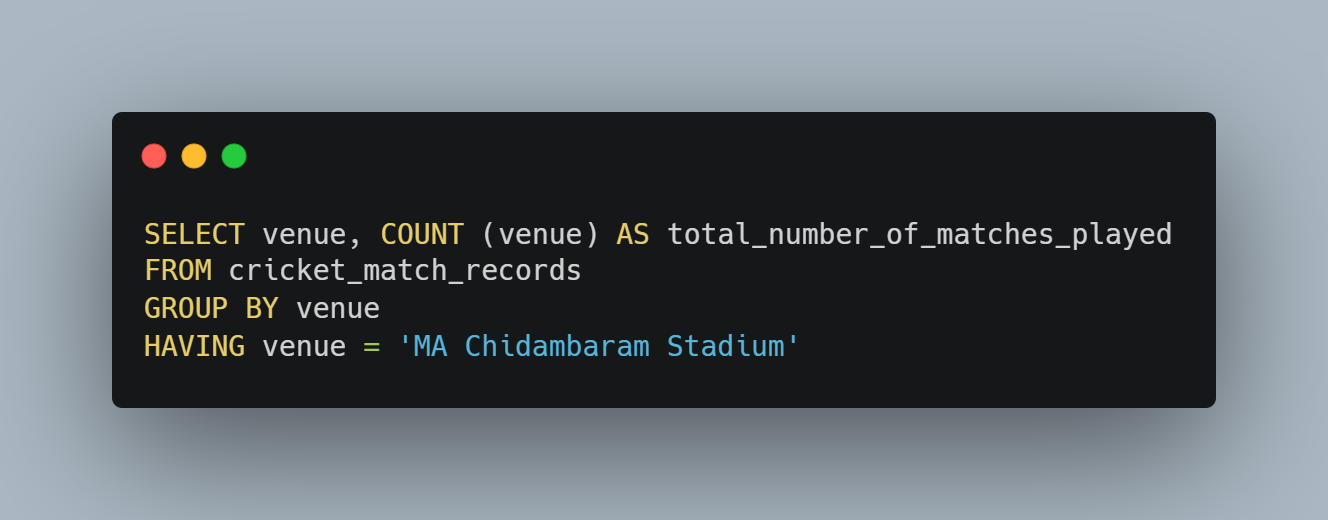
The code groups venues separately and counts the occurrences of MA Chidambaram Stadium, presenting a clear picture of its prominence.
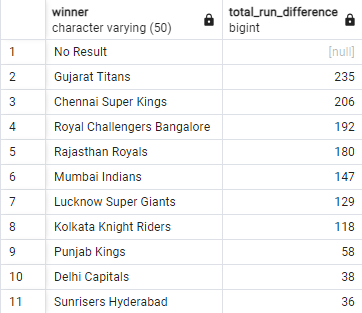
b. SUM: Adds up the values within each group.
As name suggest it will sum up the values of the given data.
The SUM function steps in to add up the winners’ run differences scored by each team in all matches. This simple yet powerful calculation offers a consolidated view of team performances.
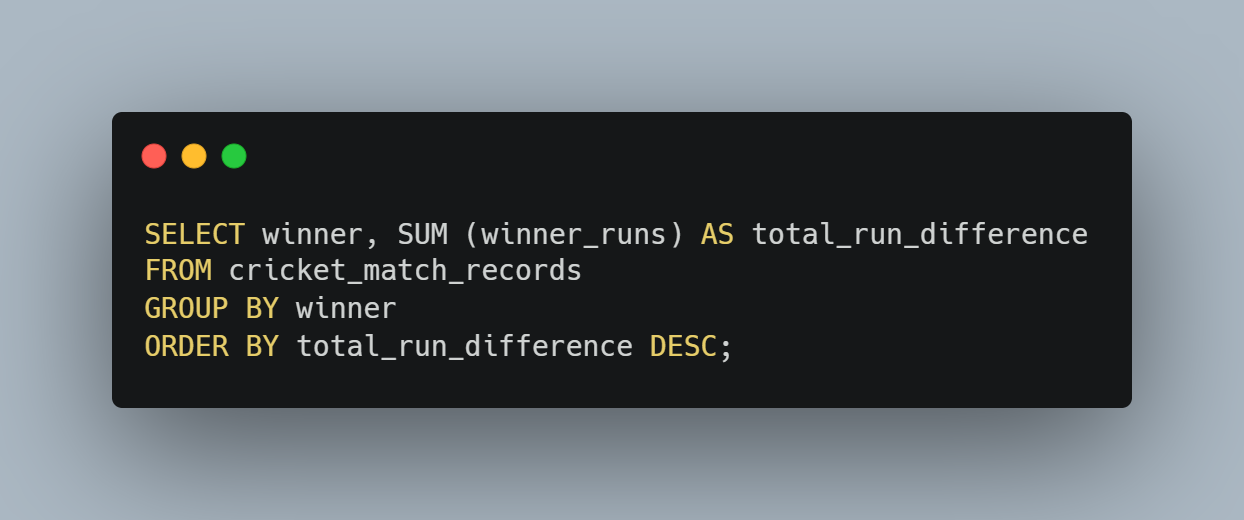
This simple yet powerful calculation offers a consolidated view of team performances.
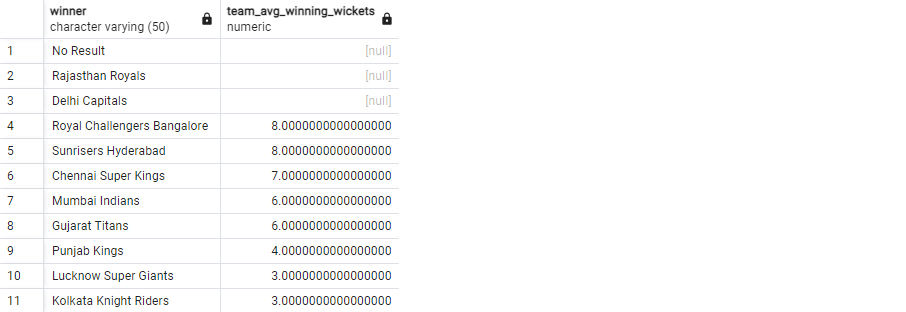
c. AVG: Computes the average of values in each group.
We calculate the average wickets taken by each team to secure victory.
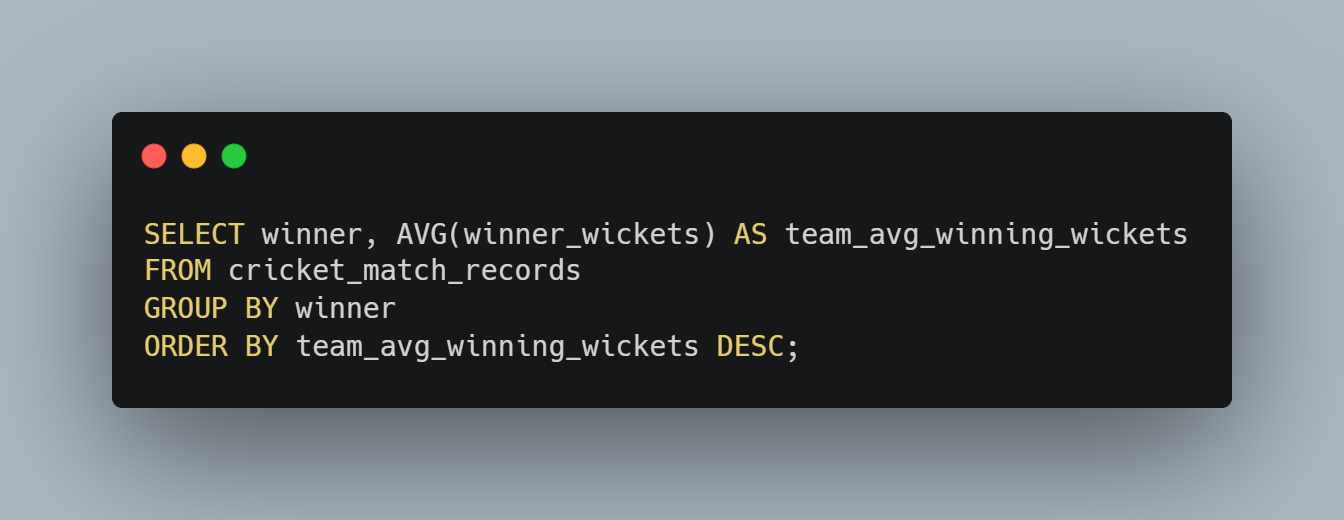
This statistical insight provides a nuanced understanding of teams’ bowling prowess.
d. MAX: Finds the maximum value in each group.
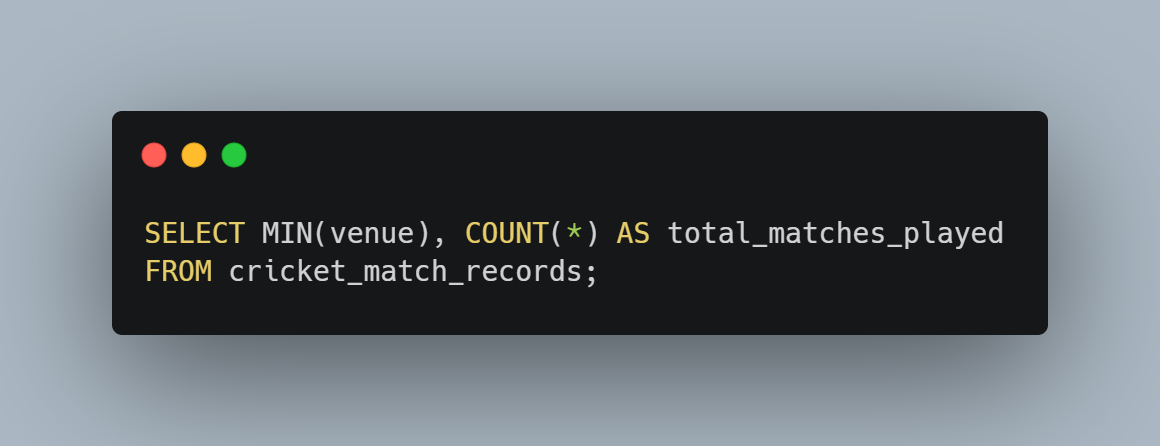
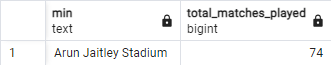
MAX and MIN functions take center stage to identify the maximum and minimum values within each group. By utilizing these functions, we unravel the extremes in our dataset, showcasing the peaks and valleys of performance.

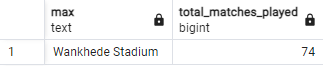
e. MIN: Identifies the minimum value in each group.
Conclusion:
In summary, Group By and Aggregate Functions are fundamental tools in SQL for organizing and summarizing data. They help you gain insights, perform calculations, and make data-driven decisions by breaking down and analyzing large datasets into meaningful subsets. These capabilities are crucial in various applications, from business analytics to reporting and data management.
I will come up with another article until then adios.
Karthik Saravanan